Most of the southern towns of the Garden Route District have bulk water in storage to address their current water demand, at least until the first winter rains. The northern parts of the Garden Route District are not looking good at the moment. Currently, the towns Calitzdorp and Zoar in the Kannaland Municipal area do not have a secondary water supply apart from their bulk storage dams.
In July 2018 the Raubenheimer dam, which is the main water source for Oudtshoorn, was at an extremely low level of 31%. Fortunately, rain over this area and a drop in the daily consumption lead to an increase in this dam’s level to 53,54% (measured at the end of December 2018). In addition to the Raubenheimer dam, Oudtshoorn has access to the Blossoms Wellfield that could still be connected to provide groundwater that would be able to sustain the basic water needs of about 50 litres per person, per day, should the town face a “day zero” scenario.
Unfortunately, the Kannaland municipal area is in a less fortunate position in terms of their main water supply at Nel’s Dam, which is located in Calitzdorp. The dam is at an alarmingly low level of 11%, leaving the town with approximately five months of water. In Zoar, the main source of water, the Tierkloof Dam ran dry after Christmas and their alternative source the Jongmansland dam on an farm Amalienstein which is at a 12% level. The water demand in this area is 1.4 megalitres of water per day, at the current rate of abstraction water in storage would last only for the next month.
The average water usage per household in the region is as follows:
- The smallest amount of water on average being used by households is in Oudtshoorn @ 121 litres per person per day;
- George 126 litres per person per day;
- Knysna 156 litres per person per day;
- Hessequa 168 litres per person per day;
- Bitou 180 litres per person per day;
- Mossel Bay 189 litres per person per day;
- The most water being used per household is in Kannaland @ 314 litres per person per day;
Background about the situation in Kannaland
On 28 December 2018, the Garden Route District Municipality (GRDM) Disaster Management Centre was contacted by Kannaland Municipality, who raised concerns that Zoar could run out of water due to the Tierkloof Dam level dropping to 10%. The Jongmansland dam, which is also an emergency augmentation dam in Kannaland was at a 20% level of water. Another issue is that the municipality has been experiencing serious challenges at their water purification works. The water treatment works are not equipped to deal with the poor quality of water supplied from both these dams. At the Calitzdorp water, purification works pose a similar problem, but added to this, the quality of water fed to town from the Nel’s dam had to include additional purification measures to ensure that the water quality stays fit for human consumption.
The GRDM Disaster Management Centre advised the Kannaland Municipality’s Technical Services to lower the pressure from the main water reservoirs that are supplying water to Zoar. The goal is to lower usage to 70 litres per person per day.
GRDM Disaster Centre also provided 3 x 5000-litre water tanks to be placed at the higher situated areas in Zoar, as these areas would be first to be affected due to the pressure reduction in the system. In addition, 1 980 x 5 litre bottled water (9 900 litres) and 7 992 x 2-litre bottle water (15 984 litres) were provided to be distributed to affected residents.
On the 17th of January 2019 the GRDM Head of Disaster Centre, Mr Gerhard Otto, joined the Kannaland Mayor, Cllr Magdalene Barry and Kannaland Municipal Manager, Mr Reynold Stevens in a meeting with Zoar community leaders to discuss the urgency of the town’s water situation as well as to inform community leaders that drastic steps would have to be taken to reduce the town’s water demand. Later on the same day, the GRDM Municipal Manager, Mr Monde Stratu and GRDM Executive Management met with the Kannaland Municipal Manager and his team to discuss the assistance required from the GRDM.
At this meeting, it was agreed that at this point in time both the towns, which include Ladismith and Van Wyksdorp, are not of immediate concern, but that the focus should be on Zoar and Calitzdorp’s. Steps will now be taken to ensure that water augmentation is prioritized and in place for the latter mentioned two towns. In order to address these urgent needs, a meeting with Provincial as well as National stakeholders was scheduled for Friday the 18th of January 2019.
On Friday, 18 January 2019’s meeting, the following action steps were resolved:
- Due to immediate capacity constraints, the Provincial Department of Local Government will deploy a full-time engineer to assist Kannaland to develop and implement both short-and medium-term drought interventions;
- Groundwater consulting firm GHT has recently completed a groundwater augmentation study for both the towns Calitzdorp as well as Zoar. The findings of this study will form the basis of emergency interventions and will not only include drilling but equipping and linking of these groundwater augmentation sources to these towns;
- The Provincial drought awareness team would be called upon to assist with the immediate roll-out of a drought and water conservation awareness campaign in the greater Kannaland area;
- The irrigation of the bulk of the Lucerne at the farm Amalienstein will be stopped in order to conserve the water available in the Jongmansland dam. The Provincial Disaster Management Centre, as well as the Provincial Department of Local Government, will meet with the Department of Agriculture and the management of the Amalienstein farm (CASIDRA) in order to come to a suitable agreement in terms of the purchase of fodder for the animals at Amalienstein due to the foreseen loss of lucerne production;
- From Monday the 21st of January 2019 the Kannaland Technical team will implement water shedding in Zoar as the demand needs to be reduced from the current 1 400 000 million litres of water per day to less than 350 000 litres per day;
- The Kannaland Municipal Disaster Management Centre have requested 20x additional 5000-litre water tanks from the GRDM to be placed in Zoar as well as at water-stressed communities in the rural Kannaland Municipal areas.
Rainfall levels from October until December 2018
Department of Water and Sanitation dam levels at the end of October, November and December 2018
|
Dam |
Gauge Plate Reading (m) December 2018 |
Rainfall for the last 7 days (mm) December 2018 |
% Full Oct 2018 |
% Full Nov 2018 |
% Full Dec 2018 |
|---|---|---|---|---|---|
|
Duiwenhoks |
18.06 |
23.00 |
68.03 |
60.72 |
50.61 |
|
Korente Vet |
10.04 |
20.80 |
38.73 |
39.59 |
38.89 |
|
Prinsrivier |
4.40 |
# |
6.75 |
6.75 |
6.75 |
|
Bellair |
4.42 |
# |
13.17 |
13.17 |
10.23 |
|
Floriskraal |
11.95 |
0.00 |
5.43 |
4.28 |
3.40 |
|
Miertjieskraal |
1.01 |
0.00 |
7.05 |
2.62 |
1.78 |
|
Calitzdorp |
14.68 |
0.00 |
13.05 |
9.73 |
8.66 |
|
Leeu-Gamka |
4.60 |
0.00 |
0.06 |
0.08 |
0.08 |
|
Oukloof |
5.05 |
0.00 |
0.49 |
0.49 |
0.49 |
|
Kammanassie |
9.61 |
0.00 |
5.08 |
4.07 |
3.19 |
|
Stompdrift |
18.38 |
0.20 |
1.14 |
5.18 |
4.85 |
|
Hartebeestkuil |
4.37 |
# |
4.52 |
4.25 |
4.08 |
|
Klipheuwel |
15.36 |
8.00 |
77.98 |
74.50 |
68.74 |
|
Ernest Robertson |
13.82 |
30.20 |
99.86 |
100.41 |
97.81 |
|
Wolwedans |
45.33 |
16.00 |
75.13 |
74.55 |
69.22 |
|
Garden Route |
26.71 |
19.80 |
67.48 |
79.40 |
79.10 |
|
Roodefontein |
9.96 |
22.60 |
101.01 |
100.67 |
98.26 |
|
Haarlem |
17.51 |
24.40 |
99.88 |
100.71 |
93.50 |
# – No rainfall station available
At the end of December 2018, the total water in storage in the Gouritz River catchment was on 17.61 %. This is 0.51% less than the previous week and 1.98% less than the 19.59% level of last year at the same time.
Municipal Dam levels at the end of October, November and December 2018
|
Municipality |
Dam Name |
Oct 2018 % Full |
Nov 2018 % Full |
Dec 2018 % Full |
|---|---|---|---|---|
|
Knysna |
Akkerkloof |
63 |
68 |
78 |
|
Mara |
100 |
100 |
95 |
|
|
Gleeb |
50 |
50 |
50 |
|
|
Hessequa |
Olive Groove |
81 |
78 |
80 |
|
Jongensfontein |
100 |
100 |
100 |
|
|
Kannaland |
JF Le Grange (Ladismith) |
90 |
60 |
30 |
|
Goevernments (Ladismith) |
90 |
80 |
50 |
|
|
Park (Ladismith) |
100 |
90 |
50 |
|
|
Gholfbaan (Ladismith) |
80 |
80 |
70 |
|
|
Tierkloof (Zoar) |
100 |
60 |
10 |
|
|
Jongmansland (Zoar) |
32 |
30 |
20 |
|
|
Nels (Calitzdorp) |
30 |
26 |
11 |
|
|
Oudtshoorn |
Raubenheimer |
49 |
48 |
53 |
|
Melville |
100 |
100 |
100 |
Table 3: Rainfall Average for each Municipal area for this reporting period
|
Municipality |
Rain fall Average October 2018 |
Rain fall Average November 2018 |
Rain fall Average December 2018 |
|
Bitou |
51.5mm |
59.0mm |
21.5mm |
|
Knysna |
62.0mm |
104.2mm |
18.4mm |
|
George Northern |
40.1mm |
42.3mm |
14.3mm |
|
George Southern |
61.9mm |
94.4mm |
25.7mm |
|
Mossel Bay |
27.2mm |
36.9mm |
26.2mm |
|
Hessequa |
21.4mm |
24.3mm |
14.1mm |
|
Kannaland |
5.0mm |
21.8mm |
14.0mm |
|
Oudtshoorn |
4.6mm |
17.8mm |
15.2mm |
Municipal water usage for this reporting period
|
Municipality |
Water Usage (Mega Liters/day) Oct 2018 |
Water Usage (Mega Liters/day) Nov 2018 |
Water Usage (Mega Liters/day) Dec 2018 |
|
Bitou |
9.78 |
11.23 |
14.12 |
|
Knysna |
13.13 |
13.44 |
13.99 |
|
George |
26.20 |
30.12 |
30.89 |
|
Mossel Bay |
20.31 |
24.34 |
30.21 |
|
Hessequa |
6.79 |
10.28 |
11.23 |
|
Kannaland |
8.48 |
8.89 |
8.97 |
|
Oudtshoorn |
16.94 |
12.88 |
13.61 |
Risk Classification for each town within the Local Municipalities at the end of 2018
|
Municipality |
Town |
High Risk |
Medium Risk |
Low Risk |
|---|---|---|---|---|
|
Bitou |
Plettenberg Bay |
|
|
x |
|
Kurland |
|
|
x |
|
|
Natures Valley |
|
|
x |
|
|
Knysna |
Knysna |
|
x |
|
|
Buffalo Bay |
|
x |
|
|
|
Sedgefield |
|
|
x |
|
|
Karatara |
|
|
x |
|
|
Rheenendal |
|
x |
|
|
|
George |
George |
|
|
x |
|
Haarlem |
|
|
x |
|
|
Uniondale |
|
|
x |
|
|
Wilderness/ Hoekwil |
|
|
x |
|
|
Mossel Bay |
Mossel Bay |
|
|
x |
|
Buisplaas |
x |
|
|
|
|
Friemersheim |
|
x |
|
|
|
Herbertsdale |
x |
|
|
|
|
Ruitersbos |
|
x |
|
|
|
Hessequa |
Riversdale |
|
|
x |
|
Heidelberg |
|
|
x |
|
|
Albertinia |
|
x |
|
|
|
Gouritzmond |
|
|
x |
|
|
Slangrivier |
|
|
x |
|
|
Stilbaai |
|
x |
|
|
|
Witsand |
|
|
x |
|
|
Kannaland |
Ladismith |
|
x |
|
|
Calitzdorp |
x |
|
|
|
|
Van Wyksdorp |
|
x |
|
|
|
Zoar |
x |
|
|
|
|
Oudtshoorn |
Oudtshoorn |
|
x |
|
|
De Rust |
x |
|
|
|
|
Klein Karoo Rural Water Supply Scheme |
x |
|
|
At the GRDM Council Meeting on 21 January 2019, the following was resolved:
- The GRDM Council has approved the purchasing of 20 x 5000-liter water tanks and cement retainer blocks to be used to erect platforms for these tanks at a cost of R120 000.00.
- Rent of 34 000 litre water tanker for a period of three months to assist with the filling of these tanks as well as tanks previously placed at water-stressed communities in the rural Kannaland Municipal areas will be paid at a cost of R240 000.00.
- The purchasing of 20-litre water containers will be distributed to households in Zoar to be used during water shedding at a total cost of R140 000.00.
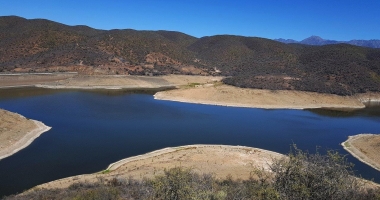
Photograph: The Nel’s Dam in Calitzdorp is currently at an alarming 11% of its capacity.
Issued by the Garden Route District Municipality’s Manager: Disaster Management, Mr Gerhard Otto